
Report Date: May 14 2020
Latest Update: May 14, 2020
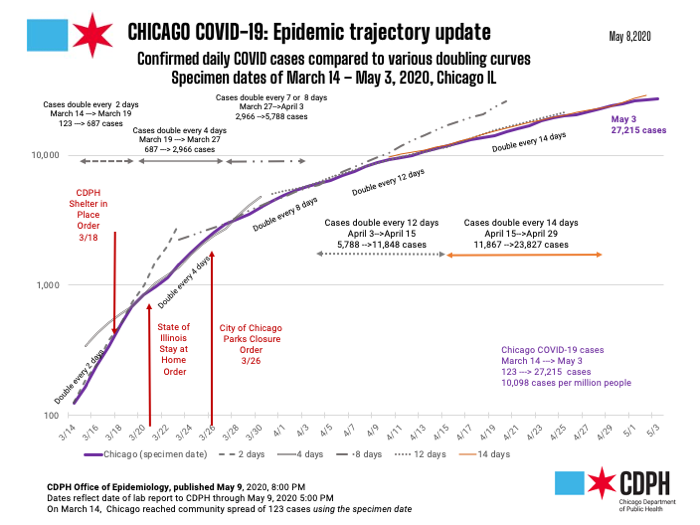
There have been 34,413 cases of COVID-19 identified in Chicago residents so far and 87,937 in Illinois. As this outbreak has spread globally, CDPH is tracking it closely and is using data to guide its response.
COVID-19 Morbidity and Mortality by Geography
| GEOGRAPHY | CASES1 | DEATHS |
|---|---|---|
| Chicago | 34,413 | 1,552 |
| Illinois (IDPH link) | 87,937 | 3,928 |
| U.S. (CDC link) | 1,384,930 | 83,947 |
| World (WHO link) | 4,258,666 | 294,190 |
| 1Does not include persons with pending COVID-19 tests or persons with COVID-19 related illness who have not been tested. | ||
COVID-19 Death Characteristics for Chicago residents
| CHARACTERISTIC | DEATHS | % TOTAL DEATHS | % DEATHS WITHIN GROUP | RATE PER 100,000 POPULATION |
|---|---|---|---|---|
| Chicago | 1,552 | 100% | 4.5% | 57.4 |
| Age | ||||
| 0-17 | 0 | 0% | 0% | 0 |
| 18-29 | 12 | 0.8% | 0.2% | 2.2 |
| 30-39 | 31 | 2.0% | 0.5% | 6.8 |
| 40-49 | 80 | 5.2% | 1.2% | 23.8 |
| 50-59 | 176 | 11.3% | 2.8% | 56.2 |
| 60-69 | 322 | 20.7% | 7.3% | 122.4 |
| 70+ | 931 | 60.0% | 20.7% | 395.6 |
| Gender | ||||
| Female | 619 | 39.9% | 3.7% | 44.7 |
| Male | 931 | 60.0% | 5.5% | 70.5 |
| Under investigation | 2 | 0.1% | 0.2% | - |
| Race-ethnicity2 | ||||
| Latinx | 405 | 26.4% | 3.7% | 52.1 |
| Black, non-Latinx | 738 | 48.1% | 8.8% | 94.1 |
| White, non-Latinx | 296 | 19.3% | 7.1% | 32.9 |
| Asian, non-Latinx | 73 | 4.8% | 9.7% | 40.6 |
| Other, non-Latinx | 22 | 1.4% | 1.7% | 18.4 |
| Under investigation | 18 | 1.2% | 0.2% | - |
| 2Race-ethnicity percentage is calculated among those with known race-ethnicity as reported by the medical provider. | ||||
COVID-19 Case Characteristics for Chicago residents
| CHARACTERISTIC | NUMBER | % TOTAL CASES(1) | RATE PER 100,000 |
|---|---|---|---|
| Chicago | 34,413 | 100% | 1,271.7 |
| Age | |||
| 0-17 | 1,140 | 3.3% | 207.7 |
| 18-29 | 5,679 | 16.5% | 1,027.1 |
| 30-39 | 6,041 | 17.6% | 1,323.8 |
| 40-49 | 6,413 | 18.6% | 1,906.0 |
| 50-59 | 6,190 | 18.0% | 1,977.9 |
| 60-69 | 4,434 | 12.9% | 1,686.0 |
| 70+ | 4,491 | 13.0% | 1,908.5 |
| Under investigation | 25 | 0.1% | - |
| Gender | |||
| Female | 16,655 | 48.4% | 1,201.6 |
| Male | 16,861 | 49.0% | 1,277.5 |
| Under investigation | 897 | 2.6% | - |
| Race-ethnicity2 | |||
| Latinx | 10,936 | 42.9% | 1,408.1 |
| Black, non-Latinx | 8,398 | 32.9% | 1,070.8 |
| White, non-Latinx | 4,146 | 16.2% | 460.7 |
| Asian, non-Latinx | 751 | 2.9% | 417.6 |
| Other, non-Latinx | 1,286 | 5.1% | 1,076.4 |
| Under investigation | 8,896 | 25.9% | - |
| 2Race-ethnicity percentage is calculated among those with known race-ethnicity as reported by the medical provider. | |||
Underlying Chronic Conditions among Chicago residents who died from COVID-19
| CHARACTERISTIC | NUMBER | % OF KNOWN |
|---|---|---|
| Known medical history | 1,503 | - |
| Underlying chronic conditions3 | 1,390 | 92.5% |
| No underlying chronic conditions | 113 | 7.5% |
| Under investigation | 49 | - |
| 3Cases with at least one underlying chronic condition. Most common underlying conditions include diabetes, hypertension, and lung disease. | ||
COVID-19 Reports
Chicago Homeless Response Data Brief, May 14, 2020
Number of Individuals tested for COVID-19 by Chicago zip code
Rate of Individuals tested for COVID-19 by Chicago zip code
Confirmed Case Rates for COVID-19 by Chicago zip code
Confirmed Cases for COVID-19 by Chicago zip code
Data Source: Providers reporting to CDPH through the Illinois' National Electronic Disease Surveillance System (I-NEDSS)
Data Source: Providers reporting to CDPH through the Illinois' National Electronic Disease Surveillance System (I-NEDSS)
COVID-19 Research Articles Authored by members of the Chicago Department of Public Health