
Report Date: May 31, 2020
Latest Update: May 31, 2020
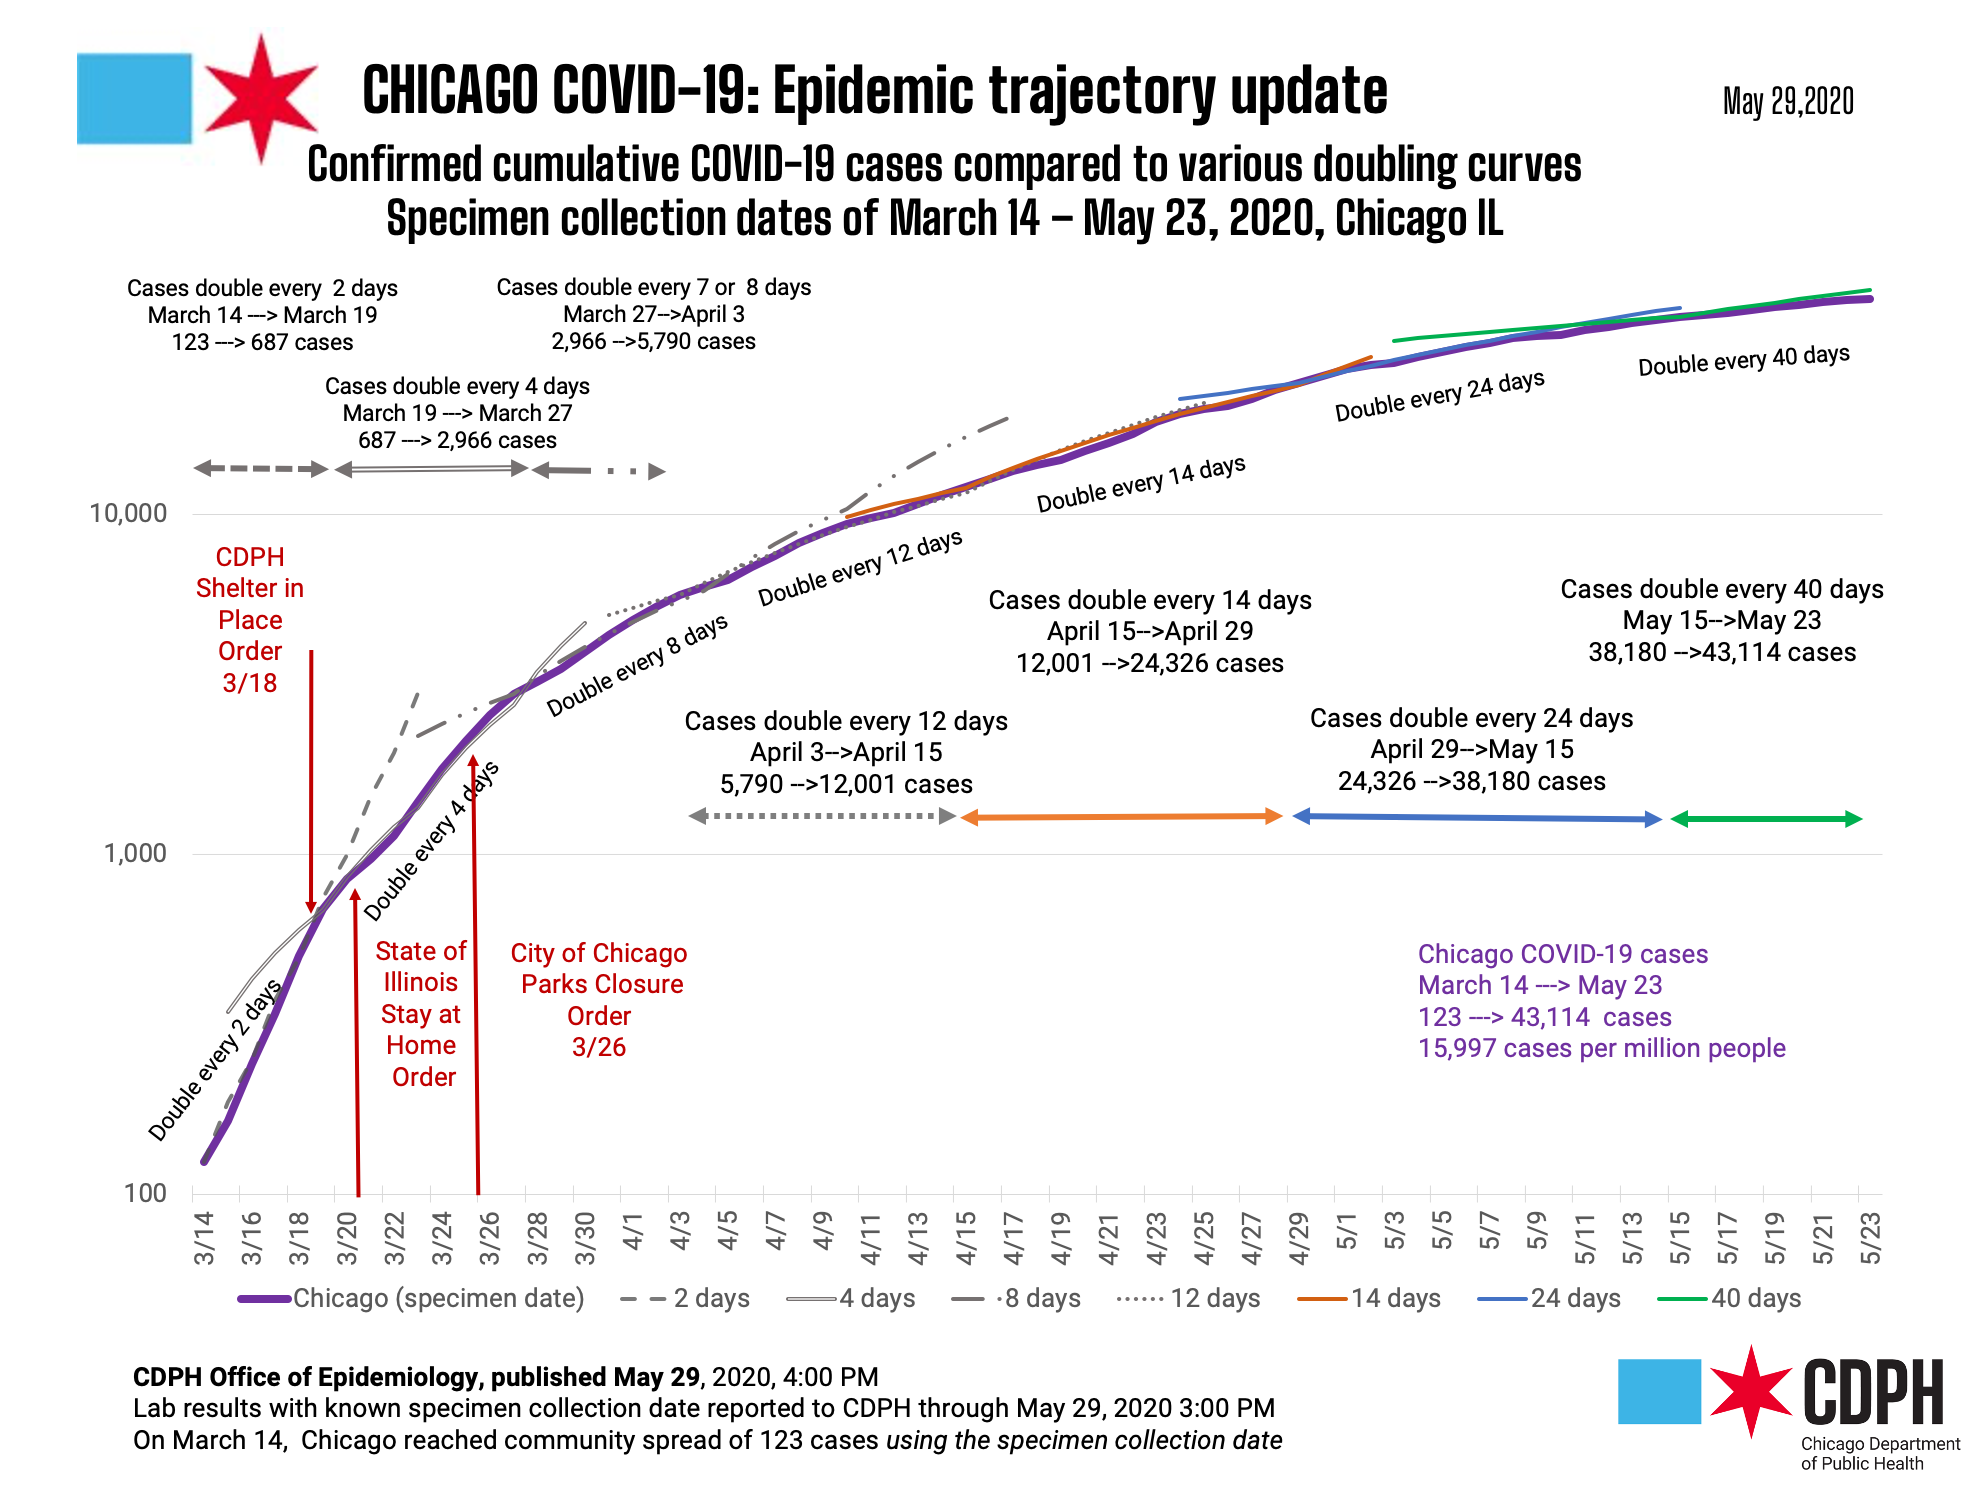
There have been 45,516 cases of COVID-19 identified in Chicago residents so far and 120,260 in Illinois. As this outbreak has spread globally, CDPH is tracking it closely and is using data to guide its response.
COVID-19 Morbidity and Mortality by Geography
| GEOGRAPHY | CASES1 | DEATHS |
|---|---|---|
| Chicago | 45,516 | 2,119 |
| Illinois (IDPH link) | 120,260 | 5,390 |
| U.S. (CDC link) | 1,761,503 | 103,700 |
| World (WHO link) | 5,939,234 | 367,255 |
| 1Does not include persons with pending COVID-19 tests or persons with COVID-19 related illness who have not been tested. | ||
COVID-19 Death Characteristics for Chicago residents
| CHARACTERISTIC | DEATHS | % TOTAL DEATHS | % DEATHS WITHIN GROUP | RATE PER 100,000 POPULATION |
|---|---|---|---|---|
| Chicago | 2,119 | 100% | 4.7% | 78.3 |
| Age | ||||
| 0-17 | 1 | 0.0% | 0.1% | 0.2 |
| 18-29 | 14 | 0.7% | 0.2% | 2.5 |
| 30-39 | 51 | 2.4% | 0.6% | 11.2 |
| 40-49 | 107 | 5.1% | 1.3% | 31.8 |
| 50-59 | 232 | 10.9% | 2.9% | 74.1 |
| 60-69 | 450 | 21.2% | 7.9% | 171.1 |
| 70+ | 1,264 | 59.7% | 22.8% | 537.1 |
| Gender | ||||
| Female | 840 | 39.6% | 3.8% | 60.6 |
| Male | 1,277 | 60.3% | 5.8% | 96.8 |
| Under investigation | 2 | 0.1% | 0.2% | - |
| Race-ethnicity2 | ||||
| Latinx | 630 | 29.9% | 3.9% | 81.1 |
| Black, non-Latinx | 936 | 44.5% | 8.9% | 119.3 |
| White, non-Latinx | 412 | 19.6% | 8.0% | 45.8 |
| Asian, non-Latinx | 103 | 4.9% | 10.4% | 57.3 |
| Other, non-Latinx | 23 | 1.1% | 1.4% | 19.3 |
| Under investigation | 15 | 0.7% | 0.1% | - |
| 2Race-ethnicity percentage is calculated among those with known race-ethnicity as reported by the medical provider. | ||||
COVID-19 Case Characteristics for Chicago residents
| CHARACTERISTIC | NUMBER | % TOTAL CASES(1) | RATE PER 100,000 |
|---|---|---|---|
| Chicago | 45,516 | 100% | 1,682.0 |
| Age | |||
| 0-17 | 1,889 | 4.2% | 344.1 |
| 18-29 | 8,049 | 17.7% | 1,455.7 |
| 30-39 | 8,078 | 17.7% | 1,770.2 |
| 40-49 | 8,354 | 18.4% | 2,482.9 |
| 50-59 | 7,912 | 17.4% | 2,528.1 |
| 60-69 | 5,664 | 12.4% | 2,153.7 |
| 70+ | 5,544 | 12.1% | 2,355.9 |
| Under investigation | 26 | 0.1% | - |
| Gender | |||
| Female | 22,347 | 49.1% | 1,612.2 |
| Male | 22,155 | 48.7% | 1,678.6 |
| Under investigation | 1,014 | 2.2% | - |
| Race-ethnicity2 | |||
| Latinx | 16,160 | 46.9% | 2,080.7 |
| Black, non-Latinx | 10,467 | 30.4% | 1,334.6 |
| White, non-Latinx | 5,152 | 15.0% | 572.5 |
| Asian, non-Latinx | 992 | 2.9% | 551.6 |
| Other, non-Latinx | 1,689 | 4.8% | 1,413.8 |
| Under investigation | 11,056 | 24.3% | - |
| 2Race-ethnicity percentage is calculated among those with known race-ethnicity as reported by the medical provider. | |||
Underlying Chronic Conditions among Chicago residents who died from COVID-19
| CHARACTERISTIC | NUMBER | % OF KNOWN |
|---|---|---|
| Known medical history | 20,071 | - |
| Underlying chronic conditions3 | 1,907 | 92.1% |
| No underlying chronic conditions | 164 | 7.9% |
| Under investigation | 48 | - |
| 3Cases with at least one underlying chronic condition. Most common underlying conditions include diabetes, hypertension, and lung disease. | ||
COVID-19 Reports
Chicago Homeless Response Data Brief, May 14, 2020
Number of Individuals tested for COVID-19 by Chicago zip code
Rate of Individuals tested for COVID-19 by Chicago zip code
Confirmed Case Rates for COVID-19 by Chicago zip code
Confirmed Cases for COVID-19 by Chicago zip code
Data Source: Providers reporting to CDPH through the Illinois' National Electronic Disease Surveillance System (I-NEDSS)
Data Source: Providers reporting to CDPH through the Illinois' National Electronic Disease Surveillance System (I-NEDSS)
Previous Reports
COVID-19 Research Articles Authored by members of the Chicago Department of Public Health