Respiratory Illness Data
Weekly Surveillance Summary
Key Points, updated 9/12/2025
- Overall acute respiratory illness activity level in Chicago has increased from Minimal to Low. COVID-19 activity has increased during the past several months. National data also suggest continued epidemic growth in much of the country.
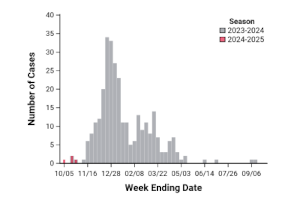
- ED visits, hospitalizations, and ICU admissions for flu, RSV and COVID-19 remain low across all age groups. Hospital admissions for COVID-19 remain highest among older adults. ED visits for COVID-19 have continued to increase since August, especially among children under 4.
- COVID-19 test positivity has increased to 5.9%. This is the highest level since January 2025. Test positivity rates for flu and RSV are unchanged and remain low.
- The CDC Center for Forecasting & Outbreak Analytics has released the 2025-2026 Respiratory Disease Season Outlook. Their scenario modeling indicates that this season will likely have a similar combined number of peak hospitalizations due to COVID-19, influenza, and RSV as last season.
- Parvovirus B19 activity has decreased in Chicago but remains elevated compared to previous years. For more information and guidance see the July 10 Health Alert.
Respiratory Illness Dashboard
The Respiratory Illness Dashboard below summarizes information about respiratory virus disease activity in Chicago, with a focus on COVID-19 (caused by the SARS-CoV-2 virus), influenza, and respiratory syncytial virus (RSV). The dashboard will be updated every Friday at 1 p.m.
Additional Respiratory Illness Data
Find CDPH’s weekly surveillance report that tracks influenza, COVID-19, RSV, and other viral respiratory disease activity in Chicago.
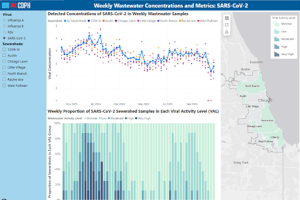
Find information about how respiratory viruses are monitored in Chicago’s wastewater.
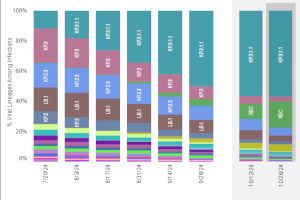
Learn more about how CDPH and the CDC are using genomic testing to monitor changes in diseases in Chicago.

Browse surveillance datasets that are available for download on the Chicago Data Portal.

Access health data for Chicago and your community.
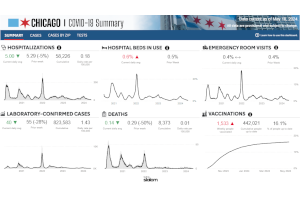
The archived COVID-19 Data Dashboard is available for historical reference.

Archived data reports
National and State Respiratory Illness Data