Cool Chi

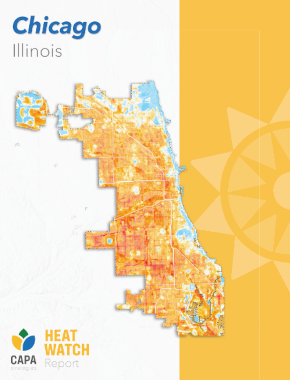
Chicago, along with 16 other communities across the country, built a team of resident scientists to measure heat across communities this summer. Factors like humidity, tree coverage, air flow, heavy traffic, humidity, and the density of buildings and concrete each contribute to how intense the heat feels. On July 28, 2023, over three shifts (morning, midday, and evening) volunteers traveled routes with heat sensors on their own cars. Each sensor recorded temperature, humidity, time, and location. And now, the results are in!
Heat Watch Findings
Heat Watch Report
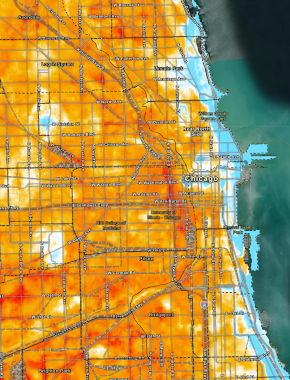
Heat Watch Maps
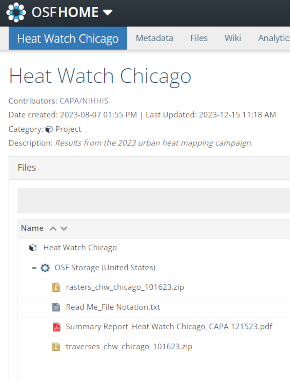
Heat Watch Data

Heat Watch Presentation
Hear from Mayor Brandon Johnson as he highlights the importance of Heat Watch 2023 and thanks all 550+ volunteers who signed up to participate:
Building Heat Watch Routes
During an extreme heat event, neighborhoods may experience the heat differently.
Throughout the summer, community partners and residents identified places in their neighborhoods that get really warm during the summer or places that are great places to visit for beating the heat. From these points, the Heat Watch team built driving routes that volunteers used on Activation Day. View all 29 routes, with starting points “A” and ending points “B”, as well as starred Activation Day hubs.
Click the image to view the route map at full size.

Our Partners
Community Organizations
- Chicago Region Trees Initiative
- Communities Organized to Win
- Let Us Breathe Collective
- Mi Villita Neighbors
- North Lawndale Community Coordinating Council/Greening, Open Space, Water, Soil, and Sustainability
- North Park Village Nature Center
- Northwestern University Defusing Disasters Working Group
- People for Community Recovery
- People’s Response Network
- Southeast Environmental Task Force
- Windsor Park Lutheran Church
Heat Watch 2023 is fully funded by the National Oceanic and Atmospheric Administration's Climate Program Office and Northwestern University's Buffett Institute for Global Affairs Defusing Disasters working group.